India's 7.8% GDP: The Problem Is Not With The Number Alone
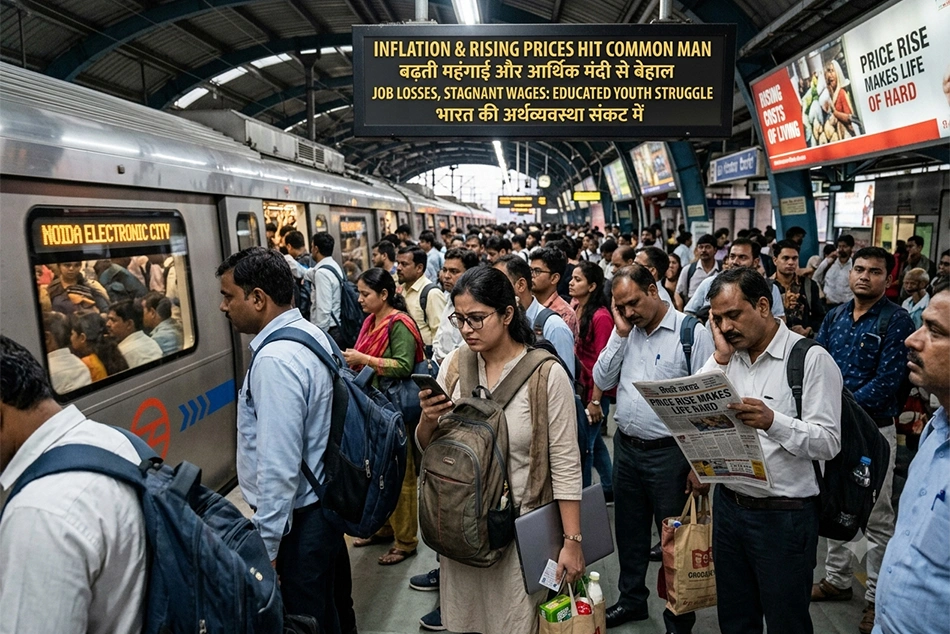
Why should 5, 7 or 9 per cent growth ultimately matter unless sustained growth gives us more productive jobs, greater investment in education and health, rising real incomes, greater household savings and asset ownership, better public services, declining vulnerability and a progressively wider distribution of economic security?
India’s latest GDP numbers appear to tell an extraordinary story. Real GDP grew by 7.8 per cent in the first quarter of 2026-27. Manufacturing grew by 9.2 per cent, fixed investment by nearly 12 per cent and financial, real-estate and professional services by more than 12 per cent. For the government, the numbers are further evidence of an economy performing exceptionally well.
Former Finance Secretary Subhash Chandra Garg has challenged this account. His argument draws attention to a striking feature of the new GDP series. Nominal GDP for Q1 2025-26, earlier estimated at about ₹86.05 lakh crore, has been revised to roughly ₹80 lakh crore. Garg compares the latest ₹88.27 lakh crore estimate with the earlier ₹86.05 lakh crore figure and arrives at nominal growth of only around 2.6 per cent.
There is a problem with this calculation. It compares estimates produced under two different national-accounting series. Once the methodology and base year change, year-on-year growth must be calculated using comparable estimates. Garg’s 2.6 per cent therefore cannot simply replace the official growth rate.
Nonetheless demonstrating that Garg’s calculation is problematic does not make the larger controversy disappear. The question remains: why has the estimated size of the same economy in the same quarter changed by around ₹6 lakh crore? For the first half of 2025-26, the downward revision is around ₹11 lakh crore. The government attributes these revisions to new data, improved methodology and more granular deflators. These may be legitimate improvements, but revisions of this magnitude require transparent quantitative reconciliation.
The present controversy does not arise in an institutional vacuum. India has already experienced disputes over the 2015 GDP series and the subsequent back series, the delayed publication of the 2017-18 employment survey, resignations from the National Statistical Commission, and the non-release of the 2017-18 Consumer Expenditure Survey after it produced uncomfortable findings. Statistical credibility is cumulative.
Suppose we accept 7.8 per cent. What then?
GDP tells us that aggregate production has increased. It does not tell us who received the additional income, whether employment became more secure, whether households accumulated assets, or whether the additional resources generated by growth were converted into human capabilities.
Consider education. Combined government expenditure on education remains around 2.7 per cent of GDP. After years in which India has repeatedly recorded some of the world’s highest growth rates, why has the share of national resources committed to education remained virtually stagnant?
Official data also show that the number of government schools declined from around 11.07 lakh in 2014-15 to 10.13 lakh in 2024-25. Some of this reflects consolidation and rationalisation, but consolidation has consequences, particularly where distance constrains access for poorer children and girls.
This reveals a peculiar conception of investment. An expressway is capital formation. An airport is infrastructure. But surely a functioning neighbourhood school is also infrastructure. A trained teacher contributes to productive capacity. Nutrition affects future productivity. Public healthcare protects both capabilities and household resources.
This is particularly important for a country whose demographic dividend is central to its growth narrative. NITI Aayog estimates that approximately 8.7 crore Indians aged 15-29 were not in education, employment or training. They should not be described as 8.7 crore unemployed people; NEET is a broader category. But for a country that considers its young population its greatest economic advantage, 8.7 crore young people outside all three systems represents an enormous underutilisation of human capability.
Employment statistics pose a similar problem. In 2025, 56.2 per cent of Indian workers were self-employed, only 23.6 per cent were regular wage or salaried workers, and 20.2 per cent were casual workers. The relevant question is therefore not merely statistical employment, it is where they work, at what productivity, earning what income, with what security and with what prospect of mobility.
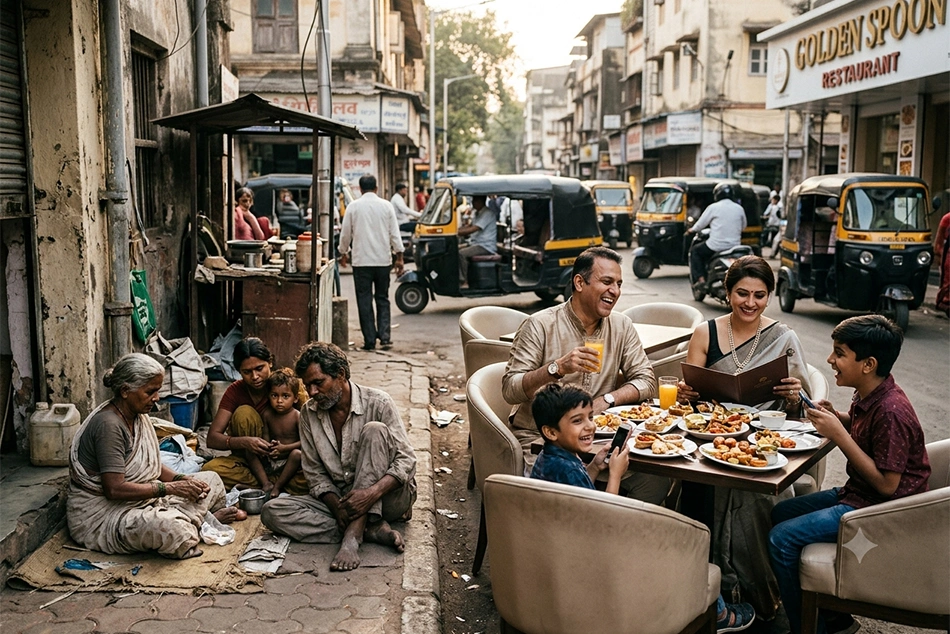
Distribution makes this still more consequential. The World Inequality Report 2026 estimates that India’s richest 10 per cent own approximately 65 per cent of national wealth, with the top 1 per cent alone owning about 40 per cent. The bottom half owns only 6.4 per cent.
When ownership is this concentrated, investment-led growth cannot be assumed to produce broadly distributed gains. Whether growth reaches the wider population depends upon employment, wages, taxation, public expenditure and the institutions determining how productivity gains are distributed.
7.8 per cent for whom?
The government’s capex narrative needs to be examined in the same way. India needs roads, railways and airports, and well-designed public infrastructure can increase productivity and crowd in private investment. But expenditure is an input; a durable productive asset is the outcome. Recent failures of newly created infrastructure remind us that the size of the capital-expenditure budget cannot itself measure the quality or durability of the assets created.
There is also a political economy to this choice. A highway can be inaugurated. An airport can be photographed. A train can be flagged off. Improvements in childhood nutrition, primary education or preventive healthcare cannot produce the same immediate political spectacle. Visible capital generates visible political returns; human capability accumulates slowly.
The poverty story raises a similar problem of what we choose to make visible. Under the World Bank’s revised methodology, around 5 per cent of Indians were below the $3-a-day extreme-poverty line in 2022-23. But at the $4.20 lower-middle-income threshold, almost 24 per cent, that is around 34 crore people were poor. At the $8.30 threshold associated with upper-middle-income economies, about 82 per cent, roughly 118 crore people fell below the line. All three numbers describe the same India.
There is something uncomfortable about celebrating India’s position among the world’s largest economies using aggregate GDP while assessing the condition of its people primarily through an extreme-poverty threshold derived from the world’s poorest economies. India’s welfare ambitions should rise with its economic ambitions.
Also Read: India’s data has lost credibility: Cong on Modi govt’s 7.8% GDP growth claim
Place beside this another fact, around 80 crore people receive free food grain from the government. This is not a poverty headcount, nor does it mean that 80 crore people would otherwise starve. Yet the scale is not economically irrelevant. Social transfers have contributed to poverty reduction, and that is an important achievement of redistribution. The developmental question is whether sustained rapid growth is progressively reducing people’s dependence on such support by creating productive employment, rising real incomes, assets and economic security.
This brings us back to the political significance of the 7.8 per cent. Statistics do not merely measure economic performance; governments use them to communicate it. GDP growth, capex announcements and extreme-poverty estimates become signals that the economy is doing well. Political management of economic meaning does not require fabricating numbers. It can occur through which indicators are amplified, which comparisons are selected, and which questions remain outside the headline.
So perhaps we are asking too much of 7.8 per cent and too little of economic policy. Why should 5, 7 or 9 per cent growth ultimately matter unless sustained growth gives us more productive jobs, greater investment in education and health, rising real incomes, greater household savings and asset ownership, better public services, declining vulnerability and a progressively wider distribution of economic security?
These are the reasons we want economic growth in the first place.
[The writer, Dr Shirin Akhter, is Associate Professor, Dept. of Economics, Zakir Husain Delhi College, University of Delhi.]
Follow ummid.com WhatsApp Channel for all the latest updates.
Select Language to Translate in Urdu, Hindi, Marathi or Arabic